
Request Monitor
Real-time API & Network Request Viewer
Monitor XHR and fetch requests for the current tab in real time. Method and status color coding, duration, size — without opening DevTools.
// screenshots
// overview
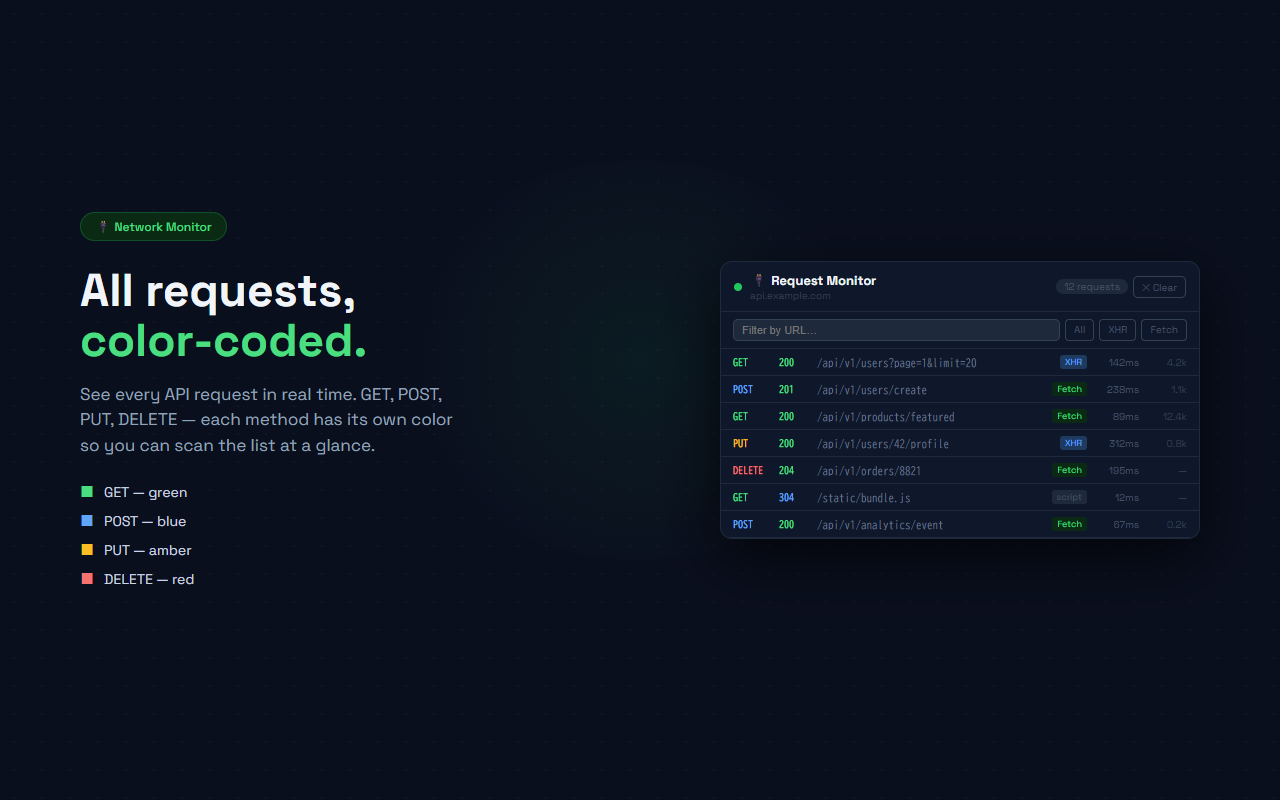
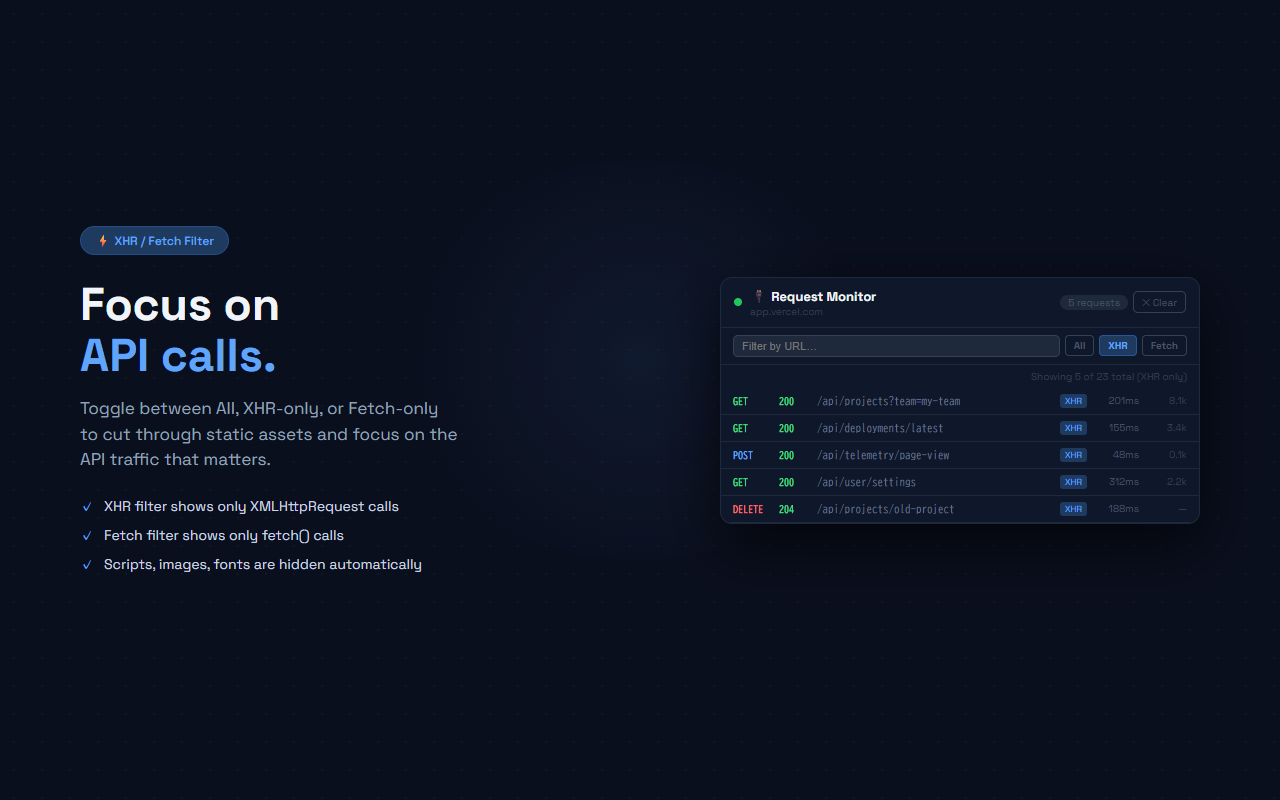
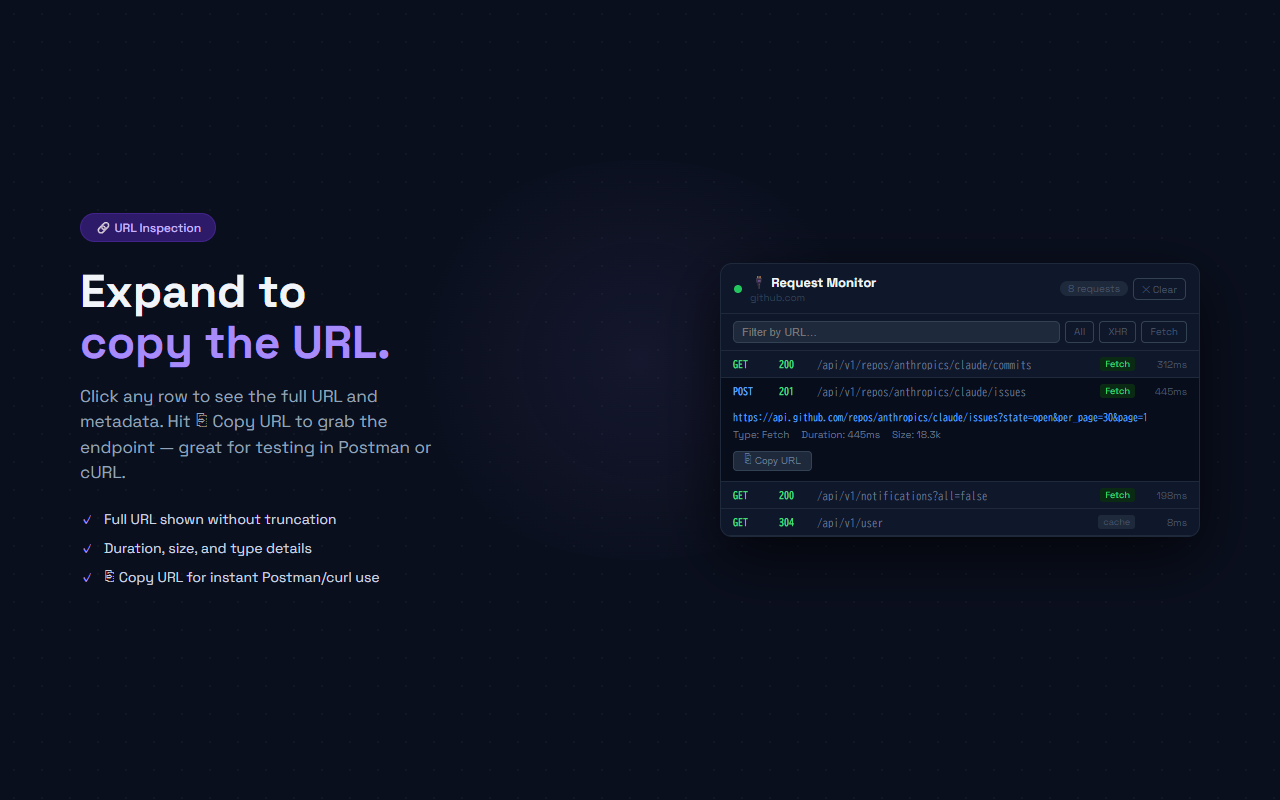
Request Monitor captures every network request made by the current browser tab and shows them in a live-updating popup. It uses Chrome's webRequest API to record request method, URL, status code, type (XHR/fetch/script/etc.), response duration, and content-length. The popup refreshes every second while open and keeps the most recent 100 requests per tab. Method colors (GET green, POST blue, PUT amber, DELETE red) and status colors (2xx green, 3xx blue, 4xx/5xx red) let you scan for problems instantly. Use the URL search filter or the All/XHR/Fetch buttons to focus on the traffic that matters. Click any row to expand it and copy the full URL for use in Postman, curl, or other tools.
// features
Live 1-second Polling
The popup auto-refreshes every second while open — see new requests appear in real time without clicking Refresh
Method Color Coding
GET=green, POST=blue, PUT=amber, DELETE=red, PATCH=purple — scan the method column at a glance
Status Color Coding
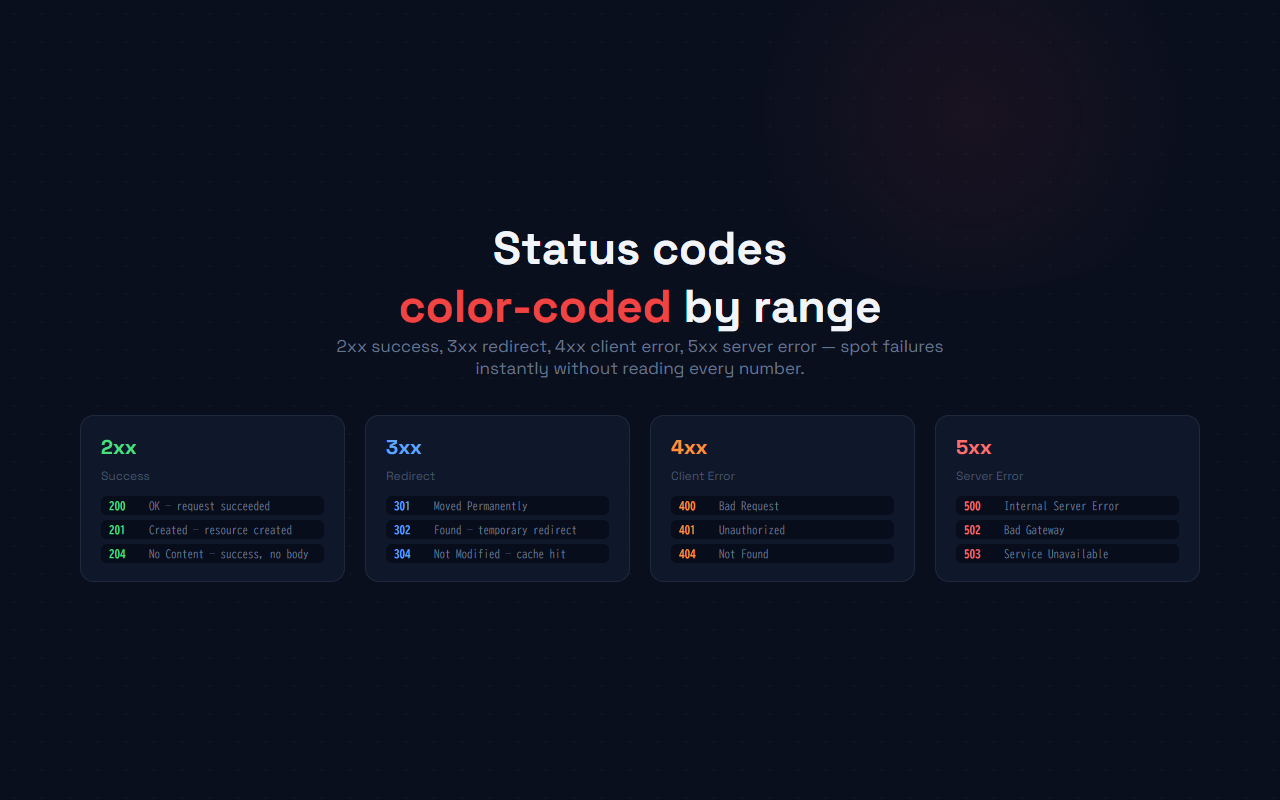
2xx=green, 3xx=blue, 4xx/5xx=red — immediately spot failed or redirected requests
XHR / Fetch Filter
Toggle between All, XHR-only, or Fetch-only to hide static assets and focus on API calls
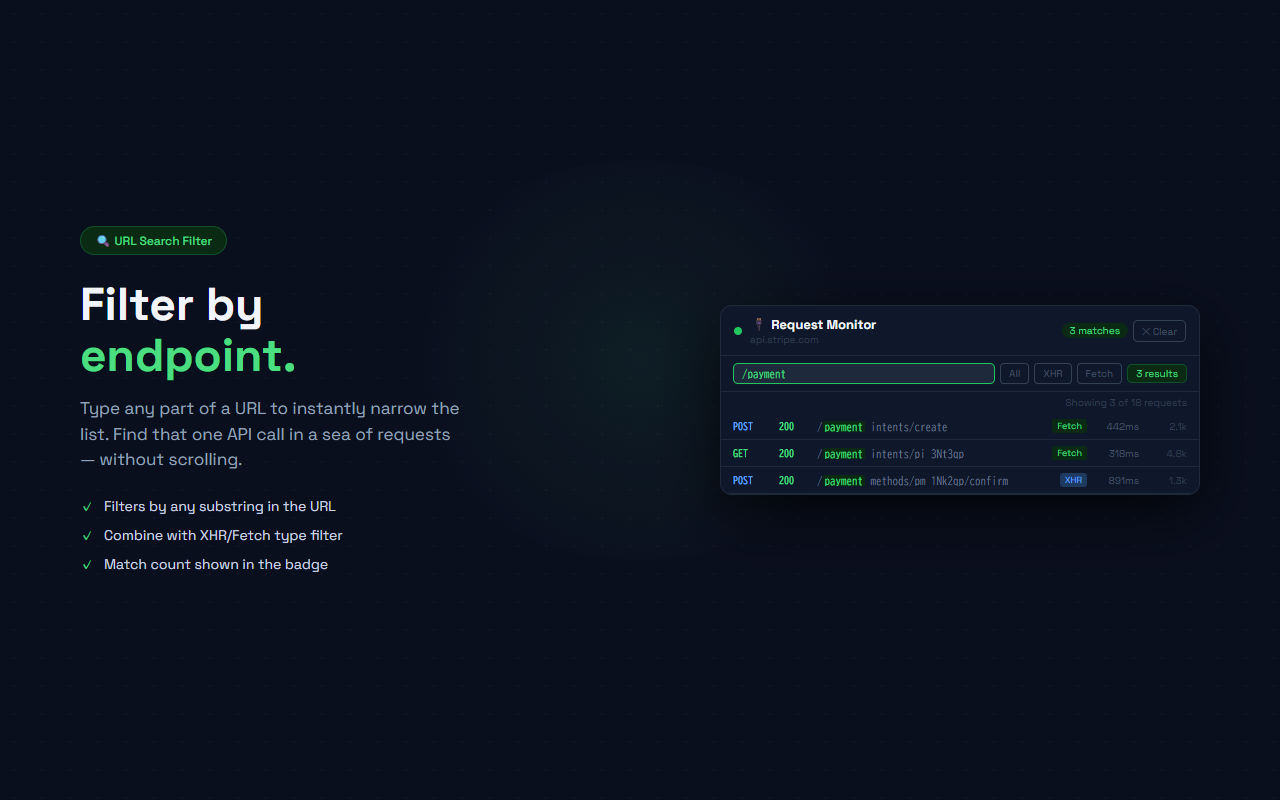
URL Search Filter
Type any substring to filter the list by URL. Combine with the type filter for precision
Expand & Copy URL
Click any row to see the full URL, duration, and size — plus a ⎘ Copy URL button for Postman/curl
// recommended for
- Front-end developers debugging API integrations without opening DevTools
- QA engineers monitoring which requests fire during user flows
- Mobile testers using Chrome on desktop to proxy traffic inspection
- Anyone who wants a quick network overview without the full DevTools panel
// faq
Is Request Monitor free?
Yes, completely free with no Pro plan.
Does it capture requests that happened before I opened the popup?
Yes. Request Monitor records requests in the background from the moment a tab loads. When you open the popup, you see all captured requests (up to 100) since the last navigation.
Will it slow down my browser?
No. The webRequest listener adds negligible overhead — it only stores the URL, method, status, and timing metadata, not the response body.
Does it capture POST body or response data?
No. Request Monitor only captures what the webRequest API provides: URL, method, status code, headers for content-length, and timing. Response bodies are never read.
Does it work on every website?
Yes. It captures requests from any tab on any URL.